

When Supply Security Becomes a Funding Decision
What the CPO commits, the CFO has already paid for. Physical material simply makes the capital visible.
Executive Summary & Key Takeaways
- The Core Disconnect: CPOs secure positions, but CFOs fund them. In a constrained market, an unfunded commitment is an illusion.
- Category vs. Portfolio: A global portfolio can look fully covered while the specific material form that runs the plant sits completely exposed.
- The Allocation Factor: Supplier scorecards do not deliver metal during a shortage; explicit contract allocation rules and committed capital do.
- The Capital Test: True security requires evaluating four numbers: monthly requirement, true percentage covered, tied-up capital, and carrying cost at the company’s hurdle rate.
Two Buyers, Two Claims on Supply
Two buyers can have the same requirement for copper, nuclear fuel, rare earths, semiconductors, or any other constrained input, yet hold entirely different claims on supply.
- Buyer A (Transactional): Holds a lower premium and works on the assumption that next quarter’s material will be available on the open market.
- Buyer B (Anchored): Holds committed volume, explicit allocation protection, and capital already positioned behind the requirement.
In a balanced market, Buyer A often appears to have achieved the better commercial result.
In a constrained market, only Buyer B has a credible claim on supply.
The difference is not a supplier scorecard—it is a funding position. The Chief Procurement Officer (CPO) commits the security position; the Chief Financial Officer (CFO) has already funded it through inventory, prepayments, committed capital, and longer-term contracts. Replacement purchases are simply the unbudgeted cost that appears when an unfunded position fails.
Security Is Often Invisible to Finance
Most organizations report inventory, working capital, prepayments, payment terms, and supplier commitments in isolated silos. However, the supply chain experiences them as a single, unified security position.
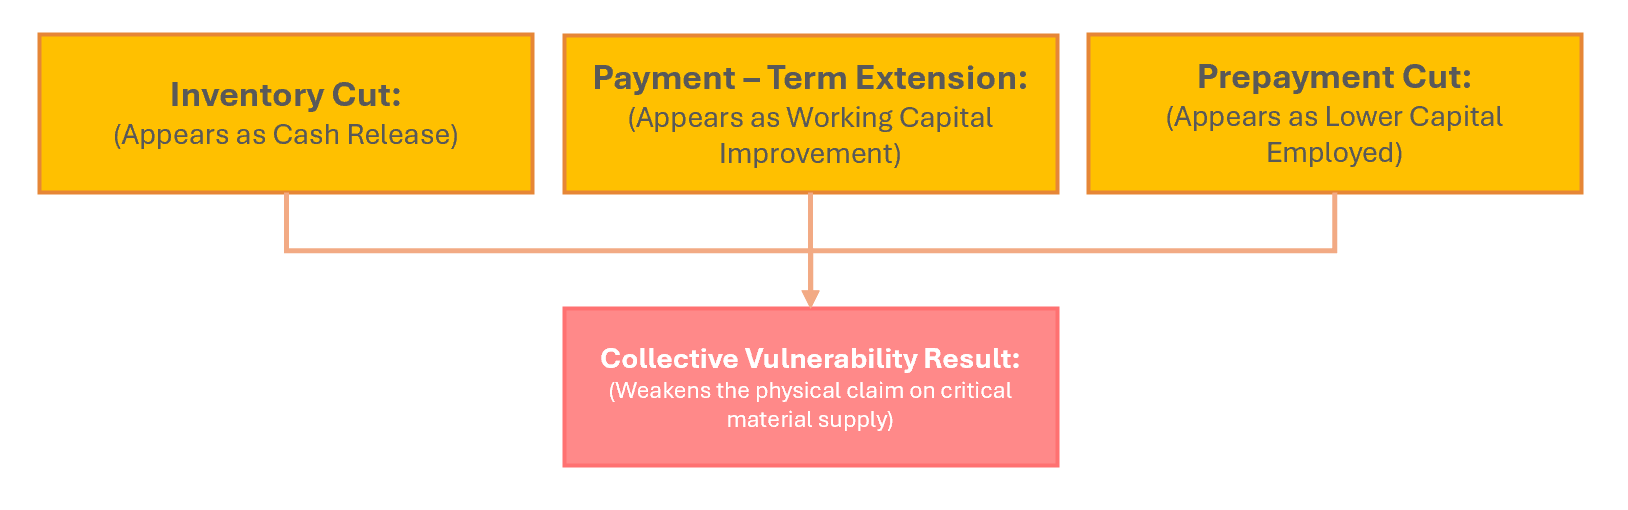
The Fragmentation Trap: How local financial optimizations create compound operational risk.
- A reduction in inventory appears as a cash release.
- A payment-term extension appears as an improvement in working capital.
- A reduction in prepayments appears as lower capital employed.
Individually, each decision may look financially attractive. Collectively, they weaken the operational claim on supply that keeps the plant running. Security rarely sits on a balance sheet as a single line item; it is fragmented across multiple line items. This fragmentation prevents both procurement and finance from evaluating the true cost and value of supply security.
The Scarce Unit Is the Category the Plant Uses
Macro Portfolio Coverage and Micro Operational Execution, we present the illustrative case of Apex Power Cable Systems, a Tier-1 European manufacturer of high-voltage transmission cables and industrial wiring. Apex buys Cathode upstream for free issue to their rod supplier.
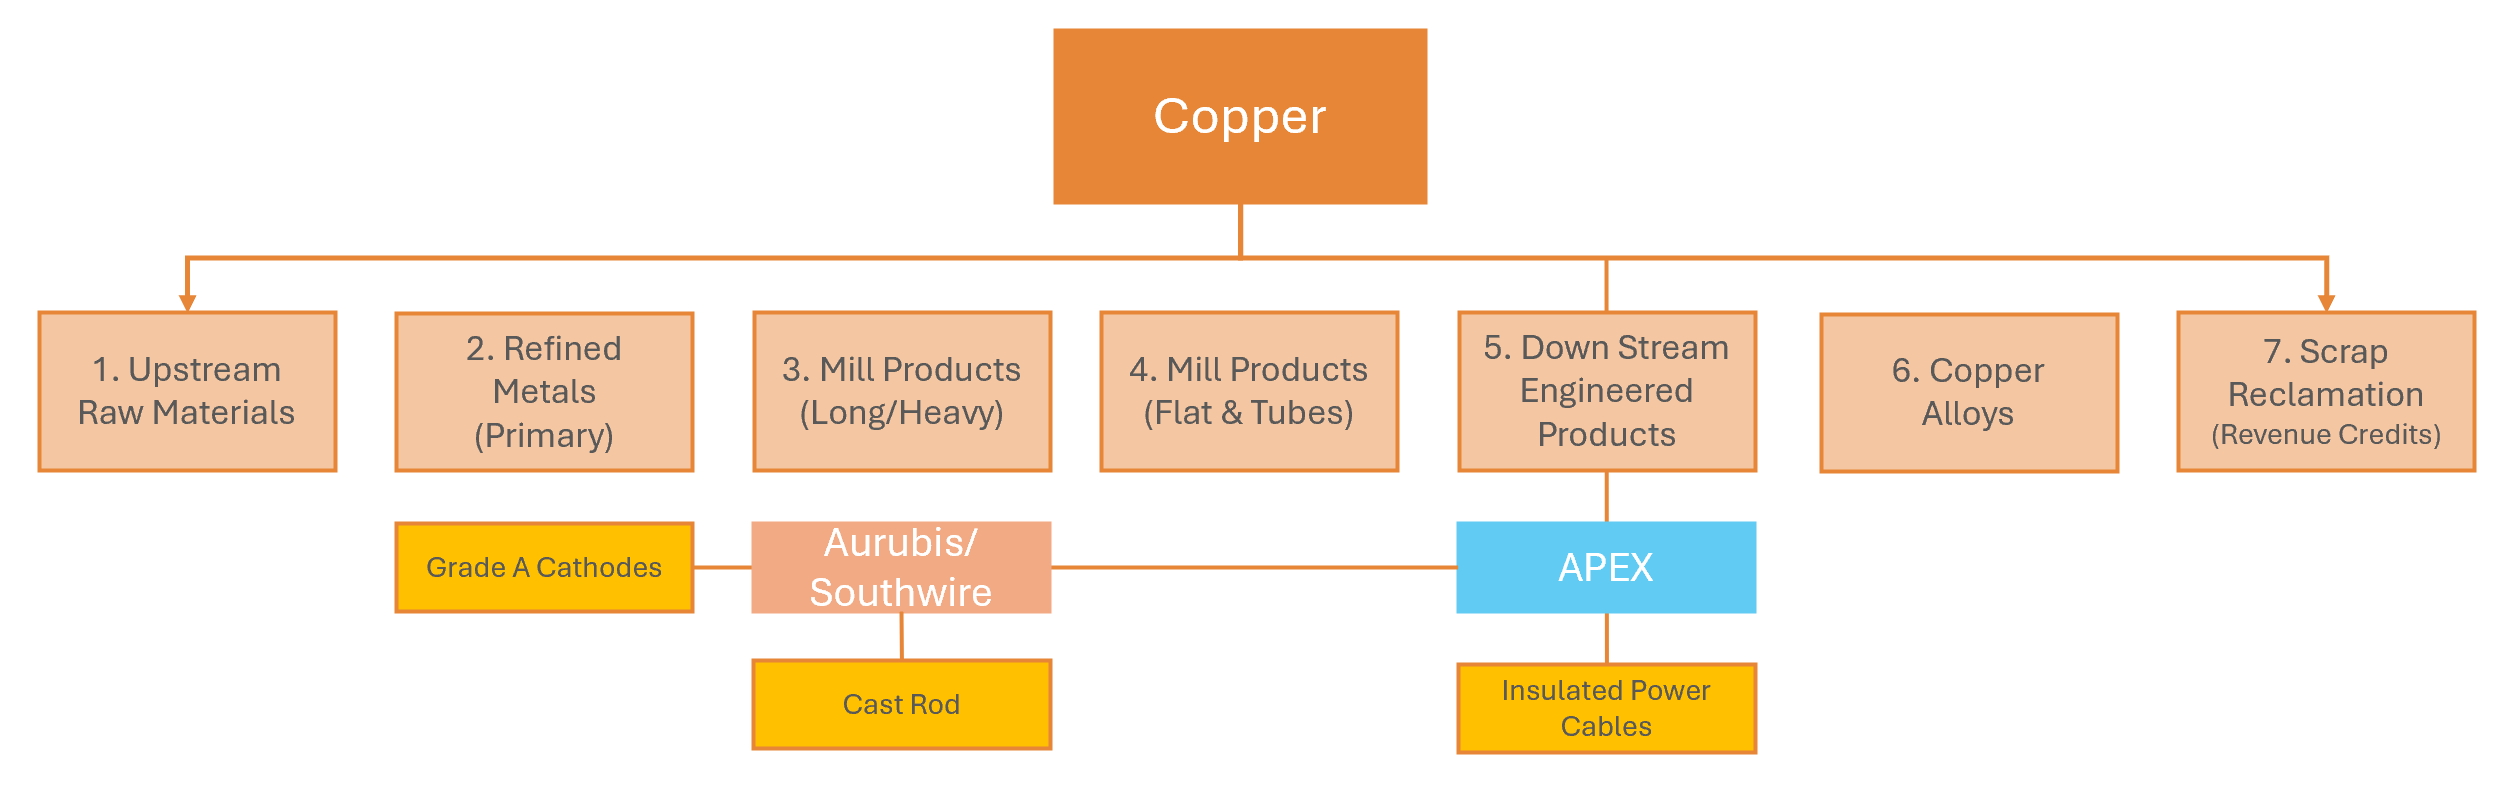
Copper is not one market: Mapping the value chain from mine to plant.
Copper is not one single market. Concentrate, cathode, secondary scrap and rod strip represent claims on vastly different processing capacities. A global copper balance sheet can look perfectly adequate while the specific category required by a given plant is already fully allocated elsewhere.
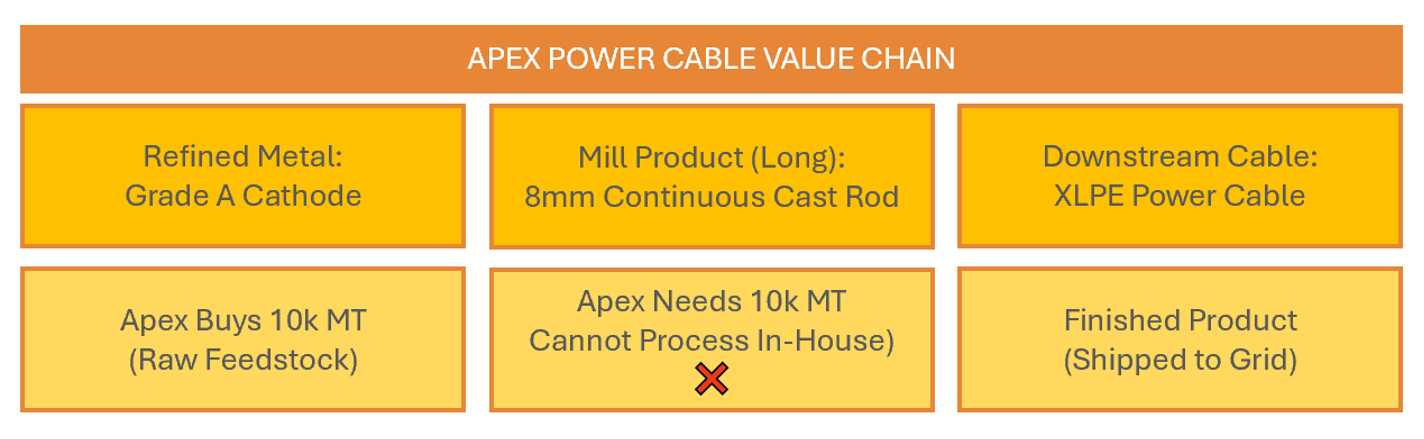
The Bottleneck Node: Where raw feedstock meets processing reality.
Portfolio Coverage vs. Operational Coverage
A portfolio can appear secure while the specific category that stops the plant remains completely exposed:
- A rod mill requiring cathode,
- A cable manufacturer requiring rod, and
- A fabricator requiring approved strip…
…are all exposed to entirely different physical constraints. Coverage of cathode is not coverage of the rod mill. A company can be 100% covered in overall copper spend while remaining entirely vulnerable in the specific physical form required on the shop floor.
This principle extends far beyond copper. The tonne, pound, or kilogram already allocated to one user is unavailable to another. Procurement can secure a claim on a finite flow, but it cannot create new flow out of thin air.
The 3 Critical Category Questions
- Which material form does the plant actually require?
- What happens if that specific category runs short?
- Who already holds a claim on the available processing capacity?
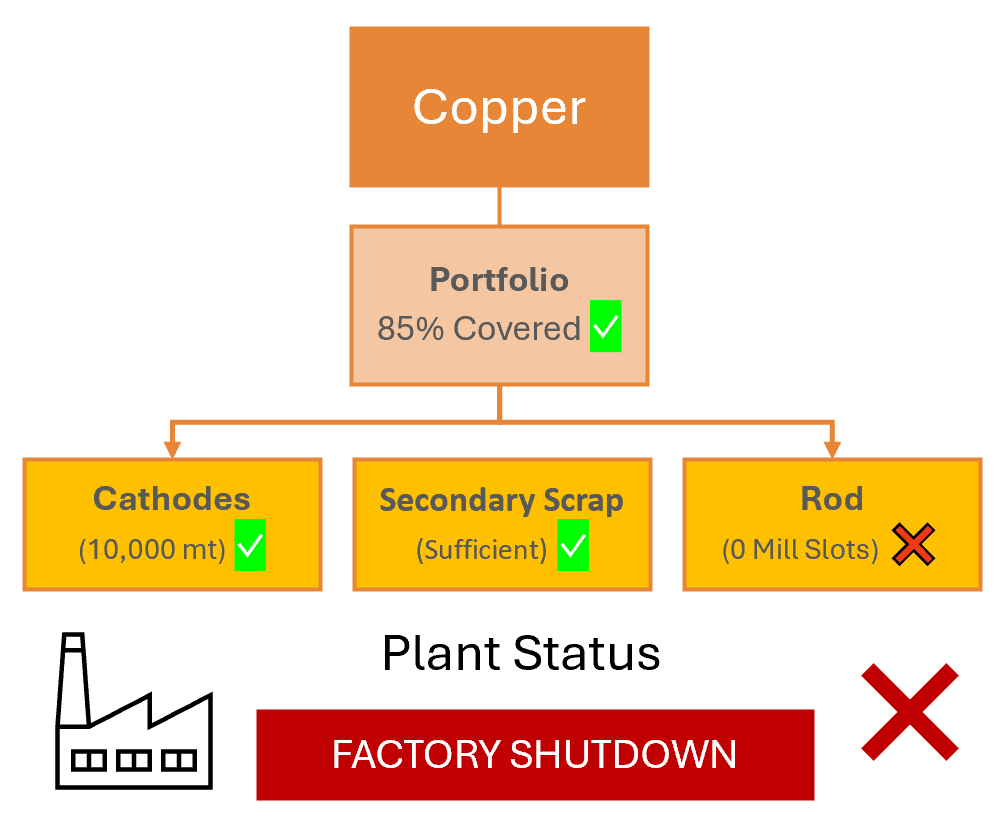
The Green Metric Illusion: An 85% covered portfolio can still stop the plant.
Allocation Is Where the Relationship Becomes Supply
Preferred-customer status matters only when it is backed by contractual rules. A supplier scorecard does not deliver the next shipment during a crunch—an allocation clause does.
The Four Allocation Mechanisms
| Mechanism | Rule Definition | What Happens During a Shortfall |
|---|---|---|
| 1. Pro-rata | Equal percentage cuts across all accounts | Every account shares the volume reduction equally. |
| 2. Priority Allocation | Volume floors for named accounts | Named accounts are protected first before remaining capacity is shared. |
| 3. Quota Caps | Historical ceiling limits | Customers cannot rapidly scale purchases beyond historical levels. |
| 4. Capacity Anchoring | Early capital commitment & offtake | Early financial commitments secure dedicated future production output. |
Volume-flex provisions and upward quantity tolerance rights belong within Priority Allocation and Capacity Anchoring. They provide the contractual right to access additional capacity when discretionary volume is scarce. These rights possess tangible financial value even when unused, because the alternative is a spot-market search after allocation has already occurred.
“Supplier relationships determine what is negotiable. Allocation rules determine what is protected. Capital determines whether that protection actually exists.”
What the Capital View Must Show
At Apex Power Cable Systems a wire manufacturer consuming 10,000 tonnes of cathode per month. Those raw cathode tonnes do not automatically cover the rod mill downstream.
Assuming a baseline market price of approximately $14,400 per tonne:
- Monthly Material Cost:
10,000 tonnes X $14,400 = $144 million / month
- Pipeline Inventory (1–2 Months):
$144 million – $290 million tied up in metal.
- Annual Carrying Cost: At a 10% hurdle rate (representing the opportunity cost of capital), holding one month of cathode costs is approx. $14.4 million / year to carry (excluding physical storage fees).
Someone is financing that position. The critical question is whether that capital supports the precise category the plant requires or merely funds a general security position that only appears covered.
The Four-Metric Snapshot
To understand supply security as a funding position rather than a simple commodity purchase, evaluate these four numbers:
- Monthly Requirement: Exact volume needed by material form.
- Genuinely Covered Percentage: Proportion backed by explicit allocation floors.
- Committed Capital: Capital tied up in inventory, pipelines, and prepayments.
- Carrying Cost: Total cost of capital evaluated at the company’s hurdle rate.
Apex holds $290 million of secured cathode while leaving its rod mill completely exposed. Similarly, a nuclear fuel portfolio can appear covered while remaining vulnerable at the conversion or enrichment stage. The green total on a summary slide is not the answer—the exposed sub-category is.
The CPO Commits the Position; The CFO Funds the Requirement
Managing supply security is not a division of ownership; it is a shared executive decision.
| SHARED DECISION MATRIX | |
|---|---|
| CPO RESPONSIBILITIES | CFO RESPONSIBILITIES |
| • Identifies plant material form | • Establishes hurdle rates |
| • Determines coverage levels goals | • Sets capital-efficiency goals |
| • Negotiates allocation clauses | • Defines payment-term policies |
| • Builds key supplier relations | • Audits return on capital |
Neither executive can manage the position independently:
- A CPO who secures a lower unit premium while leaving the financial claim on supply unfunded has not secured supply.
- A CFO who aggressively cuts inventory without understanding which category falls onto pro-rata allocation may reduce carrying costs while triggering massive operational disruption risk.
The Payment Terms Paradox
Longer payment terms improve internal funding, but they do not create physical material. Prepayments can secure future capacity, but they do not automatically create value. The underlying physical constraint remains unchanged.
Three Strategies, One Copper Price
Holding the baseline price of copper constant, compare three distinct strategic approaches:
| Strategy | Upfront Capital | Shortfall Risk | True Cost During Shortage |
|---|---|---|---|
| 1. Transactional | Low | High (Pro-rata / Remnant) | Market premium + emergency spot market costs |
| 2. Anchored | Medium / High | Low (Priority floor / Offtake) | Predictable carrying cost @ hurdle rate |
| 3. Over-Secured | Excessive | Minimal | Trapped capital & unnecessary hurdle drag |
-
Transactional Strategy
- Setup: Lower unit premium, delayed payment terms, no allocation floor, working on the assumption that spot metal will be available.
- Capital Profile: Commits minimal upfront capital.
- Shortfall Exposure: During a shortage, its claim is whatever remnant volume remains after priority customers are served.
- The Hidden Cost: A 20% reduction on a 10, 000 tonne monthly requirement represents 2, 000 tonnes —approximately $28.8 million in replacement material, before factoring in scarcity spot premiums, emergency sourcing penalties, or expedited freight fees.
-
Anchored Strategy
- Setup: Committed volume, explicit priority allocation protection, and capital positioned behind the requirement via inventory, offtake support, or prepayments.
- Capital Profile: Higher base-case carrying cost.
- Shortfall Exposure: Holds a contractually protected claim on capacity.
-
Over-Secured Strategy
- Setup: Excess physical inventory, unnecessary prepayments, and exclusivity clauses the business cannot operationalize.
- Capital Profile: Fails capital efficiency standards.
- The Hidden Cost: Security detached from real operational needs is trapped capital. An unneeded extra month of cathode locks up approx. $144 million in stock, costing $14.4 million / year at a 10% hurdle rate, without adding protection to the category that actually stops production.
Objective: The goal is not maximum security—it is efficient security.
Stress the Constraint, Not the Price
To evaluate resilience, hold the market price constant and stress a single operational node:
- A smelter outage
- A rod mill bottleneck
- A critical logistics disruption
- A nuclear conversion outage
- An enrichment interruption
| Strategy | Impact During a Severe Bottleneck Node |
|---|---|
| 1. Transactional | Faces replacement costs, spot premiums, downtime |
| 2. Anchored | Relies on funded claims and allocation floors |
| 3. Over - Secured | Survives, but at the cost of wasted capital drag |
This stress test is the exact moment where true security becomes visible. Security is not proven when the market is balanced—it is proven when it is constrained.
The Picture a Capital Committee Can Read
A practical decision model for leadership should fit on a single summary dashboard:
| CAPITAL COMMITTEE SUMMARY | |
|---|---|
| 1. Current Security Position | Detailed by Category |
| 2. Proposed Security Position | Detailed by Category |
| 3. Additional Capital Required | $ |
| 4. Additional Carrying Cost | $ @ Hurdle Rate |
| 5. Incremental Protection Gained | Allocation Floor Level |
Leave fully visible anything that cannot be cleanly explained. This forces Finance and Procurement to evaluate the exact same operational trade-offs:
- A lower unit premium that later reappears as emergency replacement purchases was never a saving.
- A prepayment that contractually secures allocation protection often is.
This framework is the Total Cost of Security (TCS) test. The name is optional—the comparative analysis is not.
How to Secure Supply
Supply chain leaders seeking true resilience should present four validated proofs to the executive board:
- The Category: The exact physical material form the plant consumes.
- The Profile: The operational consumption rate it supports.
- The Protection: The contractual allocation mechanism attached to it.
- The Funding: The capital structure supporting that protection.
Do not enter negotiations asking only for a lower unit premium and extended payment terms. The supply chain is already funding the material somewhere; a customer unwilling to share in that funding burden is actively asking to be placed lower in the allocation hierarchy. TCS exists to place those numbers on one page.
The Universal Test
Copper makes these economics transparent because market inventories are large and benchmark pricing is clear. However, the underlying principle is universal across industrial supply chains.
The exact same logic applies wherever capacity is allocated:
- Nuclear Conversion & Enrichment: Rationed on the same rules as a full smelter or rod mill.
- Semiconductors & Rare Earths: Governed by identical capital-backed allocation hierarchies.
Whenever capacity is allocated rather than freely available on demand, supply security becomes a funding decision.
- Relationships decide what is negotiable.
- Allocation rules decide what is protected.
- Capital determines whether that protection exists.
- Total Cost of Security determines whether that protection is worth paying for.
Nuff said …
Related content: TCS Prism™ · TCS Category Profile · TCS Engine · TCS Advisory ·